Hello folks. I hope your new year is off and running to a great start.
Just a quick update to let you know that your iGraphs™ may look a little different due to a new feature that was just added. After taking in some of your feedback, the Therapy-Science team added a feature that allows you to pad the x axis so that you can show up to 30 sessions without having to add any data to the graph.
Some of our instructors felt that the look of a graph – especially in the early stages of data entry – looked “unbalanced”. We agreed and so we now have a new feature that allows you to set the minimum number of sessions that should be shown on the x axis of your iGraph™. By default, it is set to 20 (the preferred size for new iGraphs™), but you can set it to any size between 0 and 30.
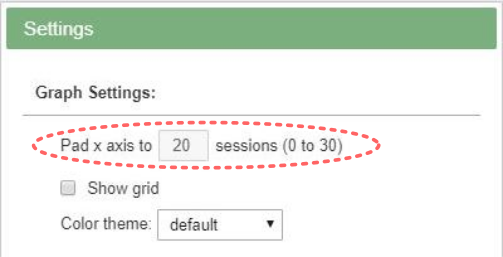
That’s right, zero is an option! If your data exceeds the pad x axis value, then it will scale to match the number of data points you have entered. If you set it to zero, then the graph will behave like it always has, only scaling the x axis to the number of data points you have added.
You can find this setting at the top of the graph settings dialog.
Drop us a line and let us know what you think about this new feature!
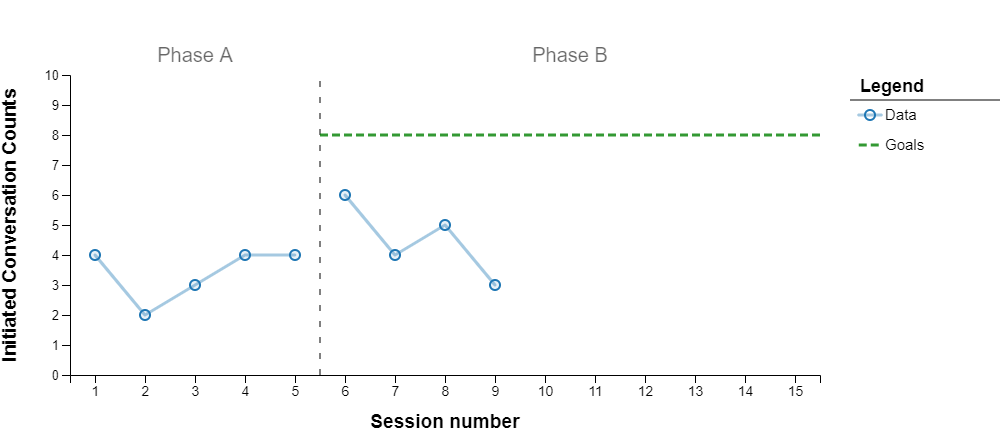
Two iGraph™ images showing the new setting in action.
Original iGraph™
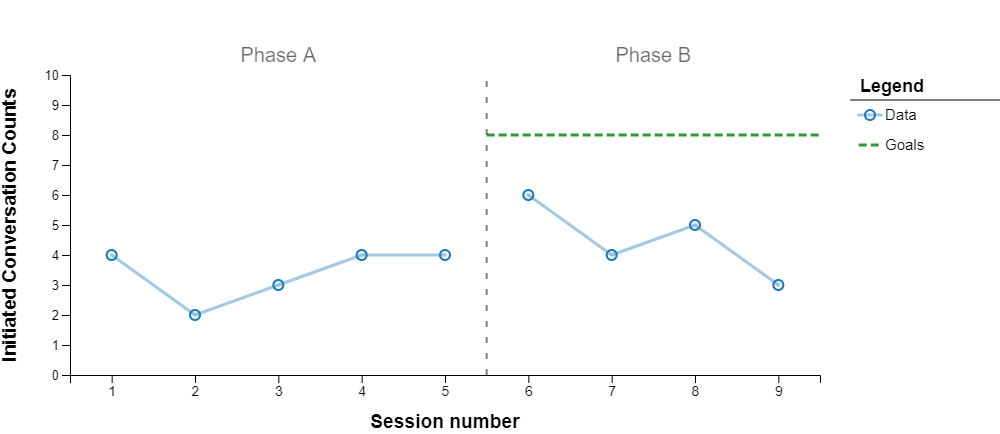
The same iGraph™ with pad x axis value of 15