
New to Therapy-Science?
This is the place to get a general overview of what
Therapy-Science is and what it can offer.
Click on the headings to learn more about that topic.
Get Therapy-Science for your classroom: Get Started
If you would rather just speak to someone: Have Someone Call Me
Therapy-Science represents our firm belief that with the right set of tools, client data can be a guide to ongoing therapy efforts and produce better results than what is provided by current clinical practice.
Modern data visualization and analytic techniques, coupled with good critical thinking skills, can provide practitioners with the ability to leverage daily tracking activities into powerful evidence-informed decision making supports. To support this type of data inclusive approach to therapy, we have developed a set of tools to facilitate evidence-informed decision making.
Therapy-Science is intended for educators, students, practitioners, and scientists – essentially anyone interested in teaching, learning, or applying single-case design and analysis.
For the Educator.
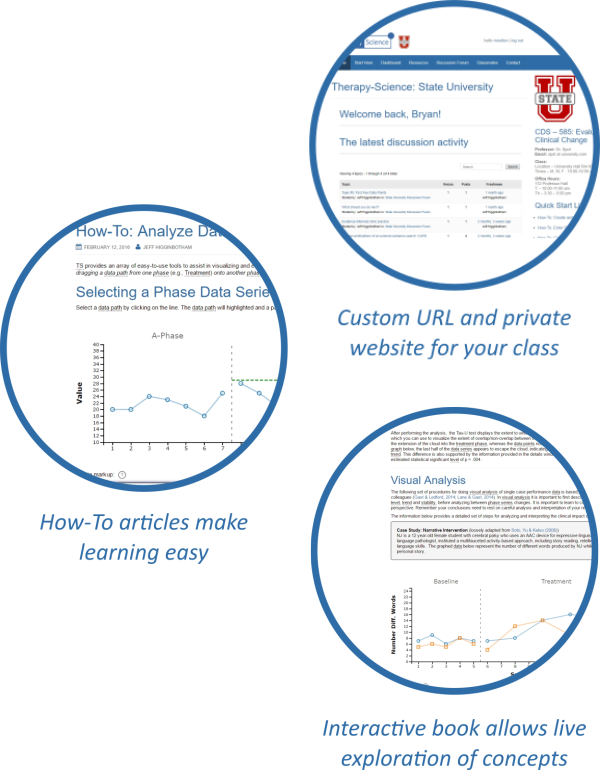
Being cloud-based, you can log in from anywhere and have access to all your data as well as a growing body of helpful resources to support your classroom. Therapy-Science is a helpful partner as you guide your class through the transition from student to practitioner.
For the Graduate or Advanced Undergraduate Student.
This may be your first class in research and/or clinical methods.Therapy-Science will provide you with a framework for incorporating critical thinking strategies and scientific principles into your emerging therapy practice.
For the Inquisitive Practitioner.
Therapy-Science provides an easy and straightforward way to organize your intervention plans and data to perform ongoing evaluation of your client’s performance. Currently, we provide you with a set of learning resources and tools for you to visualize data to monitor your client’s progress throughout therapy.
For the clinical investigator.
Therapy-Science contains an advanced suite of single-case visual analysis, quantitative analysis and data management tools. This includes the ability to graph multiple data series on a single graph, provide visual and quantitative analysis of level, trend and variability/stability, and utilize a variety of visual-quantitative analysis techniques, including Percent Non-Overlapping Data, Conservative Dual Criteria Test, and the Tau-U Test of Non-Overlap.
The graph below was created by typing the data into the data window using a simple syntax. Data series labels are entered at the start of each line, terminated with a colon, and then followed by comma separated data points. The vertical bar (also known as the pipe) character, “|”, is used to create a new phase.
The simple and familiar text input area makes it easy to enter and manage data for your graph. There are two data series in this graph displaying the frequency of parent and child utterances. You can include up to five different data series on any graph.
Facilitating Storybook Reading
NOTE: Data adapted from the intervention research by Vogler-Elias (2009).
Tip:
The graph shows two phases. The first phase was during the child training phase, the second was when the parent was also trained. It is easy to show this detail by adding some custom labels to the data markup.
Facilitating Storybook Reading
See how the label keyword was added to each phase? You now know the basics and can begin to create powerful visual representations of your therapy data.
Keep reading to learn how to use this graph to easily analyze the data to help guide your clinical decision making process.
A visual representation of data is the first step towards making data-informed decisions. The single case graph helps to compare data across phases and provides an initial overview of level, trend, and variability for the data paths.
However, the single case graph of Therapy-Science is more than just a visual representation – it is an interactive tool that allows you to explore the data and perform more advanced analysis both visually and quantitatively. Because it is an interactive tool that extends beyond a static representation of the data, the “single case graph” included in Therapy-Science can be (and often is) referred to as an interactive-graph or iGraph™ in order to distinguish it from its more passive kin. You’ll notice the icon next to the Legend heading that helps distinguish an interactive single case iGraph™ from a basic visual graph.
Tip:
Getting a quantitative analysis of a single data path is as simple as clicking your cursor on a data line. Go ahead and try it out by clicking on the Parent Talk data in the Child Training phase on the graph below. The analysis results panel will drop down and provide you with important information about the level, trend and variability of this data path.
Facilitating Storybook Reading
The analysis results panel is filled with information about the data path. Advanced visual and quantitative information can be accessed through this panel.
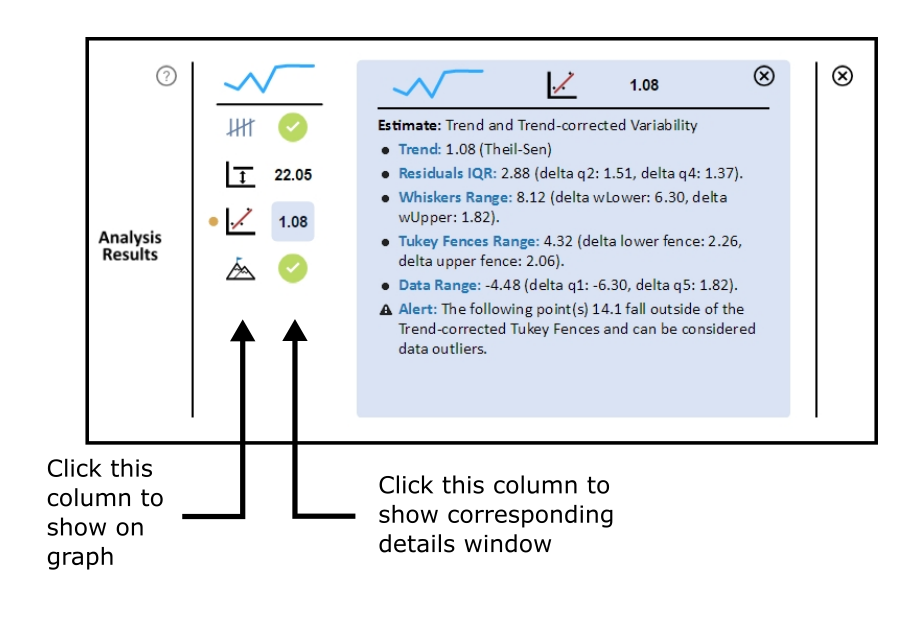
The analysis results panel shows visual and analytic details about the data in the graph.
- Select a data path just by clicking/tapping on it. This will display the analysis results panel for that data path below the graph.
- Select an icon in the left column to display a visual analysis of the data path.
- Select the icon in the right column to obtain the numerical details to help quantify what you are seeing on the graph.
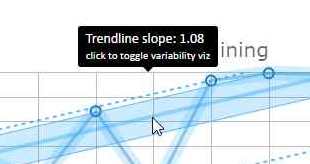
- Click or tap directly on a level and trend line to visualize the variability of that data path.
- Click the level or trend line to step through variability visualizations.
Therapy-Science provides specific ways to customize the iGraph™ to improve your visual analysis experience through the Settings panel, which can be displayed by clicking on the ![]() at the top right of the graph screen.
at the top right of the graph screen.
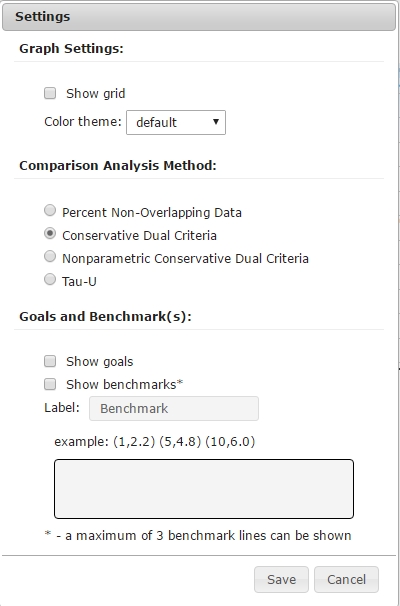
The settings dialog allows you to customize the visual and analytic elements of the Single Case iGraph™.
- Graph Settings can be used to reduce visual clutter and improve your info-aesthetic experience.
- Select from the variety of visual-quantitative analysis options in the Comparison Analysis Method. The selected analysis will be available in the analysis results panel when you drag one data path onto another.
- The Goals and Benchmarks check boxes toggle the availability of these items on the iGraph™ and Legend.
In addition to the Settings panel, the descriptive titles for the graph, axis, and phases can be customized. This allows for the data to be presented in a very clear, self-documenting visual.
You can also begin to customize the analysis elements of your iGraph™ by crafting custom goals for each phase – or track progress across phases with Benchmarks. Benchmarks are useful in providing sophisticated ways to include visual comparisons against a targeted performance profile or other standardized reference. Therapy-Science includes resources to help you understand, implement, and utilize goals and benchmarks in your practice. The Single Case iGraph™ makes it easy to put those tools into practice and make them a regular part of your decision making process.
Therapy-Science provides a set of advanced visual and quantitative analysis tools to assess changes in your client’s performance across therapy phases. To compare data across phases, drag the data path from the current treatment phase onto its baseline (or previous) phase. The analysis results panel below the graph will show information for both individual data paths as well as several comparative analyses in the right column.
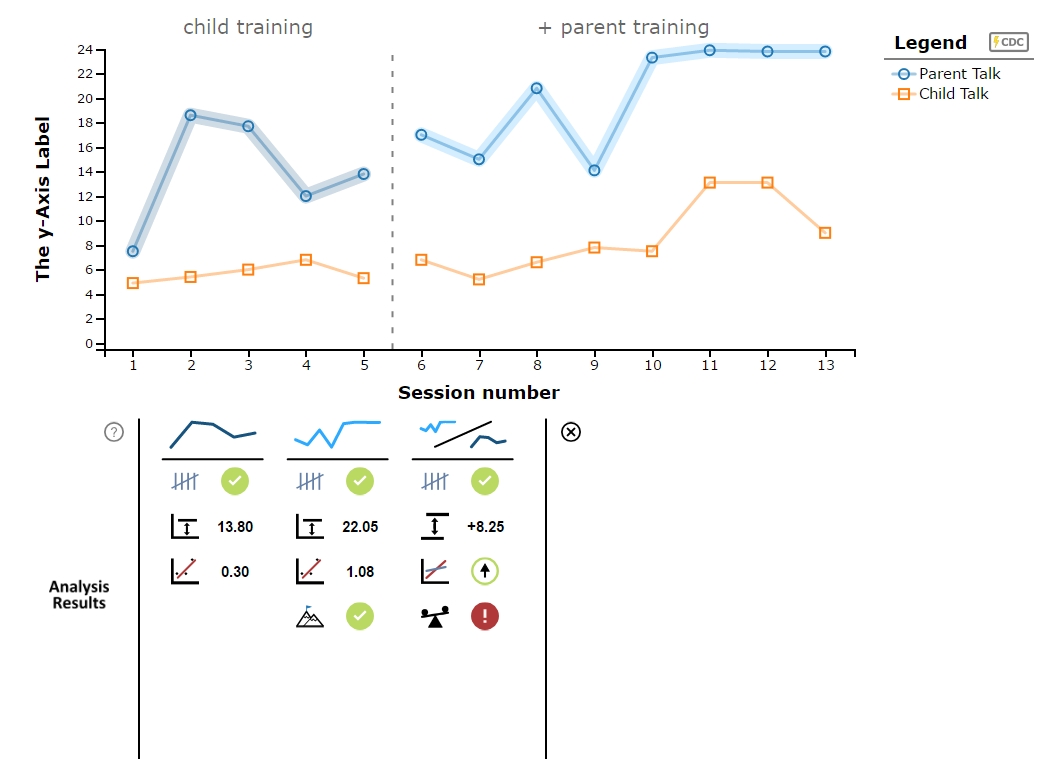
The analysis results panel showing the three data path analysis columns (from left to right): the baseline data path, the treatment data path, and then the comparison between the two.
- In all data path columns in the analysis results panel, clicking on the left icon will provide a visual analysis based on the particular analysis method. Clicking on the right icon will display the particular quantitative and statistical details of the comparison method in the details window to the right.
- The first analysis item indicates whether there is enough data to collected to make a valid comparison.
- The second analysis item compares the levels of the two phases of data.
- The third analysis assesses differences between the slopes of the two phases being analyzed. The icon on the right indicates whether the slope of the treatment phase is lesser, equal or greater than the baseline slope.
- The last analysis provides visual and quantitative details for several advanced comparative analysis techniques, including the Percent Non-Overlapping Data Points, the Conservative Dual Criteria Test and the Tau-U test of Non-overlap. Select the desired comparison test in the Settings menu (
 ) at the top-right of the graph page, prior to dragging the treatment data path onto the baseline phase.
Now try out the advanced comparative analysis yourself!
When you create graphs from your Clinician Dashboard, you have the option of adding notes to help capture important information about your interpretation of the client’s progress, any important issues regarding data collection, or other helpful pieces of information that would be useful to document for reference. To access the notes, simply click on the Notes bar at the bottom of the graph and the notes section will expand. Here you can add and format notes to log your client’s progress and record any conclusions that you have made based on your client’s treatment data.
You can print these notes and the graph by selecting the print button at the top-right of the graph, next to the settings button. This allows you to create a paper-based or a PDF report for a client’s file. You can also create a report with a visual analysis of your graph, which can be very useful for meetings and documenting the effectiveness of your intervention. The graph below is included to show you the notes section and allow you to experiment with the printing of the graph and notes. While the notes in this example are not editable, you can analyze the graph in various ways and print the notes and graph to paper or save it as a PDF file.
Clients are the focal point of the Clinician Dashboard. Clients and their data can be created and shared among colleagues. Multiple graphs can be created for each client to reflect the various treatments that you may apply to address their needs.
The labels of the dashboard can be customized to fit the working model of your profession and clientele (e.g., Clients, Students, Patients; Treatment, Intervention, Therapy).
A professional membership includes the ability to organize your clients into folders so that you can keep your work organized!
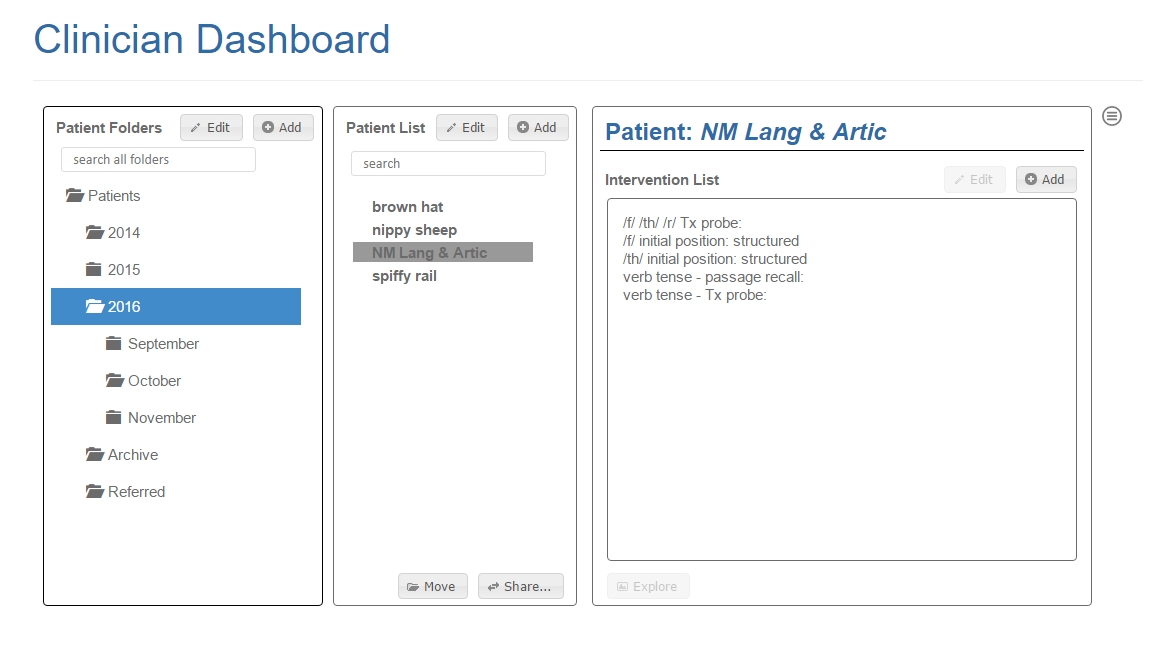
Take advantage of the built in name generator for a safe and effective way to anonymize the clients so that data can be shared with colleagues for consultation or discussion without fear of exposing personal information.
Appraising Change: Making Evidence-Informed Decisions in Speech-Language Pathology
This resource is an interactive textbook written to help students, clinicians, and clinical researchers develop and cultivate three primary activities that they should incorporate into their therapy practice:
- Critically consider and construct their client’s treatment plan
- Develop meaningful goals and hypotheses
- Analyze performance data with a demanding eye for detecting meaningful behavioral change
We believe that tracking, graphing, and analysis procedures should address real clinical practice questions (i.e., whether a change has occurred, if the change is important, if the change is due to the intervention, etc.), and comply with the workplace requirements, clinic schedules, and workload of the practitioner.
Traditionally, the graphing and management of clinical data has been cumbersome at best. Ad hoc tools – such as graph paper and pencil, Excel, etc. – are useful to some extent, but required significant effort and customization for every client. Therapy support tools should alleviate work, not create more of it! Therapy-Science has delivered a single-case graph that is easy to use. Coupled with modern data visualization techniques Therapy-Science provides practitioners with the ability to leverage their tracking activities into powerful evidence-based clinical decision-making supports. In our book, we have identified 6 types of tools needed to make data-informed decisions:
- Critical Thinking Tools
Critical thinking tools provide an informative guide to help you organize, plan, and conduct efficient and effective clinical interventions. Throughout the book, we will provide you with effective ways to 1) foster a critical thinking perspective about clinical intervention, 2) develop a coherent approach to outcome and goal development, and 3) select measurement techniques that address your client’s desired goals and outcomes. Chapter 2 will introduce you to critical thinking and decision making strategies that are used throughout the rest of the text. - External Evidence Tools
External evidence tools enable you to query current research findings about the effectiveness of available interventions for your client. Chapter 3 will show you how to construct researchable questions and evaluate evidence provided by evidence based practice and research databases (e.g., ASHA’s practitioner portal). - Goal Development Tools
Therapy-Science proposes the use of functional outcome oriented approach for developing intervention goals. Chapter 4 will describe the elements of outcome and goal construction, developing a coordinated set of treatment outcomes, and how to optimize them for data visualization and to make clear evidence-informed decisions. - Observation-Based Tracking Tools
A good data tracking plan is designed to monitor the presence, absence or status of key behaviors that indicate whether your client is making progress toward their target goal or outcome. In Chapter 5, you will learn how to observe and track different aspects of communication behavior using direct observation, time-based behavioral measurement, and indirect tracking methods, including individualized rating scales and goal attainment scaling. - Single-Case Design Learning Tools
Therapy-Science uses a single-case design approach to help you organize your therapy and visualize your data. Chapter 6 provides instructional resources for you to learn and use single-case design to organize and implement effective and efficient therapy programs. Video examples and interactive exercises are presented throughout the text to promote active engagement with the materials. - Data Representation and Analysis Tools
Chapter 7 will also teach you to use the powerful suite of visual representation and analysis tools provided by Therapy-Science. Once entered, your data is immediately available for visualization and analysis. It is presented in a simple and straightforward way to minimize distractions, support understanding, and facilitate decision making.
In addition to providing information to understand the tools and how to apply them, the additional support provided by the included glossary and references help to provide the conceptual foundation and vocabulary that is necessary to develop a complete understanding of the concepts and practices that are covered by the book.
As simple and intuitive as Therapy-Science has been designed, everyone needs support on how to use these tools and to discover new and alternative ways of dealing with particular clinical problems. To address these needs, we have provided an ever-expanding set of articles that present How-Tos and Tools, Concepts and Strategies. Procedures are explained in direct language accompanied by video clips and interactive examples to help you practice your skills.
Can’t remember how to title your treatment phase? Just navigate to the Resource page and type in a search term, like “phase title” or “phase label”. Viola! the answer appears in seconds! Our search engine can be used to locate How-Tos, definitions and references related to the topic you are searching for.
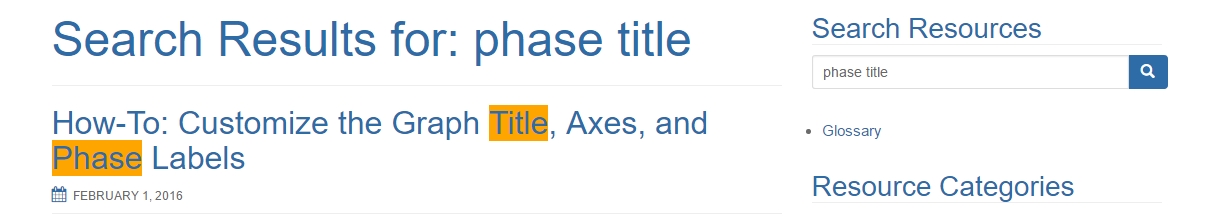
Therapy-Science resources are fully searchable, so it is easy to learn
new concepts or get a refresher on a topic or procedure that needs a quick review.
Some Common Questions
That’s excellent news – because that is exactly why we created Therapy-Science!
Simply fill out the form below and we’ll get you started on a path that can help you to educate your students with the tools and resources specifically designed to help bolster any course that involves .
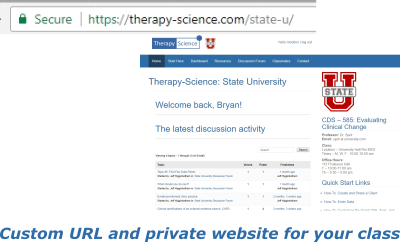
As an instructor, as long as your classroom includes 20 or more subscribing students, there is no cost to you. Simply include a student membership to Therapy-Science as part of their required course materials and you will get a free account on your very own private website that will be set up just for you and your students.
This means that you will get access to all that Therapy-Science has to offer: data visualization and analysis tools, an interactive book, a dynamic glossary, references and links to relevant external resources, and more! – with the added benefit of a private discussion group created specifically for your class. Here you can post and interact with your class. You can also assign discussion topics, post interesting data and graphs to help reinforce learning objectives, and encourage student discovery and mastery of concepts through practice in Therapy-Science’s interactive environment.
The cost to the students is $89 for a two-year membership. Two years will allow them to utilize all that Therapy-Science has to offer for use in their academic, clinic and research training – helping to develop their skills and resources as they transition from student to professional scientist-practitioner. Note, information for supporting your clinical supervision faculty is included in the next section.
Fill out the form below and we can begin to have a conversation about how Therapy-Science can best assist you and your students.
Absolutely.
Your students will want to take advantage of their Therapy-Science membership to help transition the concepts from classroom to the real world through the clinical practice component of their education.
As a Clinical Supervisor, you will be able to share data with students to help guide and mentor them as they learn to use evidence to inform their clinical decisions and document their client’s performance. You will also be able to own and manage client data, and reassign clients to new students as needed.
As long as at least 20 students in your department are members of Therapy-Science, then we can begin to provide free accounts for university clinical supervisors Please contact us for details.
Sure! Depending upon how big your team is, there may be several solutions that work for you. We would be glad to talk to you about your specific needs and find the right solution for you and your clinic
Fill out the contact form below, and we can begin to discuss the best way to meet your needs.
Of course.
Fill out the contact form below, and we can call or email you and begin to get your questions answered.